Data and Ofsted Report
"Nayland Primary School is a nurturing and exciting place to learn." Ofsted, March 2025
Please find our latest Ofsted reports at the bottom of this page. Alternatively, follow this link to access the Ofsted website: Nayland Primary School - GOV.UK (get-information-schools.service.gov.uk)
2024 Outcomes
Phonics Screening 2024
Year 1 92.6% pass rate, Year 2 retakes (x2) 50%
KS1 2024 Attainment
Reading 73.3% at expected standard, 33.3% at greater depth standard
Maths 76.7% at expected standard, 23.3% at greater depth standard
Writing 73.3% at expected standard, 26.7% at greater depth standard
KS2 2024 Attainment
Reading 87.5% at expected standard, 50% at greater depth standard
Maths 96.9% at expected standard, 40.6% at greater depth standard
Writing (teacher assessed) 81.3% at expected standard, 18.8% at greater depth standard
Attainment Reading/writing/maths: 78% at expected standard, 18.5% at greater depth standard
Average Point Score Reading 108.3, Maths 106.3, Grammar/Punctuation/Spelling 108
2023 Outcomes
Phonics Screening 2023
Year 1 93.3% pass rate, Year 2 retakes (x5) 100%
KS1 2023 Attainment
Reading 75.9% at expected standard, 24.1% at greater depth standard
Maths 82.8% at expected standard, 31% at greater depth standard
Writing 75.9% at expected standard, 17.2% at greater depth standard
KS2 2023 Attainment
Reading 78.8% at expected standard, 30.3% at greater depth standard
Maths 84.8% at expected standard, 24.2% at greater depth sandard
Writing (teacher assessed) 75.8% at expected standard, 12.1% at greater depth standard
Attainment Reading/writing/maths: 69.7% at expected standard, 12.1% at greater depth standard
Average Progress Score (Suffolk data) Reading +1.2, Maths +1.88, Writing +0.89
Average Point Score Reading 105.9, Maths 106.1, Grammar/Punctuation/Spelling 102.5
The following Key Stage 2 data is taken from the government's school performance measure website:

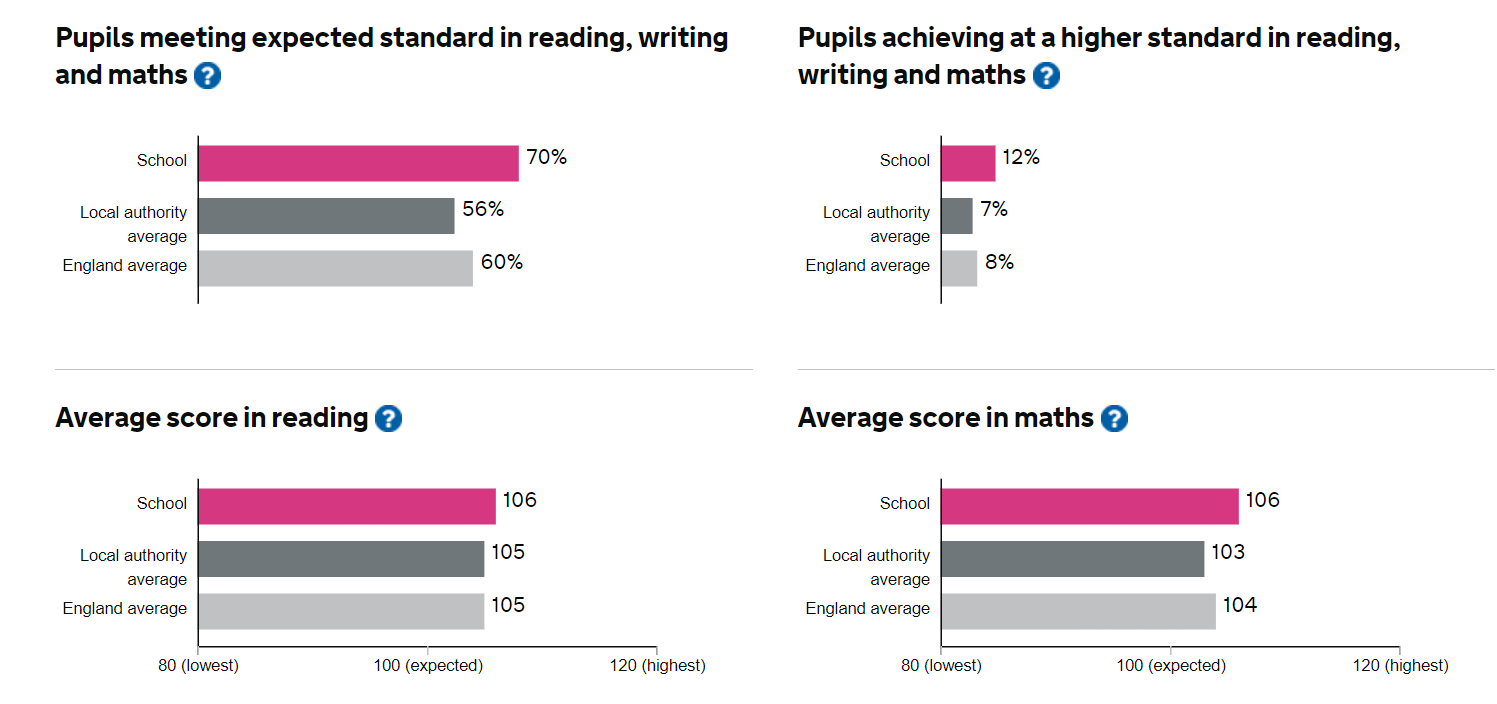
To see the document in full please find below the school's performance tables on the DfE website:
Compare the performance of schools and colleges in England - GOV.UK (www.gov.uk)
2022 Outcomes
Phonics Screening 2022
Year 1 86.7% pass rate, Year 2 retakes (x4) 100%
KS1 2022 Attainment
Reading 88.5% at expected standard, 23.1% at greater depth standard
Maths 96.2% at expected standard, 19.2% at greater depth standard
Writing 84.6% at expected standard, 11.5% at greater depth standard
KS2 2022 Attainment
Reading 93% at expected standard, 46.7% at greater depth standard
Maths 80% at expected standard, 46.7% at greater depth sandard
Writing (teacher assessed) 76.7% at expected standard, 26.6% at greater depth standard
Attainment Reading/writing/maths: 66% at expected standard, 16.6% at greater depth standard
Average Progress Score (Suffolk data) Reading +2.26, Maths +4.01, Writing +1.54
Average Point Score Reading 108.2, Maths 108.4, Grammar/Punctuation/Spelling 108.3